The block-level locations are back. The publishing schedule has settled into a biweekly cadence. On the surface, the LAPD data story reads like a win. But plot the daily count of incidents the department actually publishes and a different problem comes into view — one that predates the location fight, was never really about NIBRS, and has not been resolved: starting in March 2024, LAPD reported roughly half as many incidents per day, and it has never climbed back to where it was.
We have covered the LAPD transparency story from three angles: the lawsuit, the NIBRS excuse for going dark, and the block-level release that appeared the week after the June primary. Each of those was about where incidents were placed on the map — a geocoding and precision question. This post is about a separate defect: how many incidents show up at all. Those are not the same problem, and restoring one did not fix the other.
The picture
Below is the daily count of crimes LAPD reported to data.lacity.org from January 2020 through mid-2026, with a seven-day rolling average over the raw daily totals. The series stitches together the legacy UCR feed and the newer NIBRS feed, deduplicated at the transition by taking the higher of the two on each day.
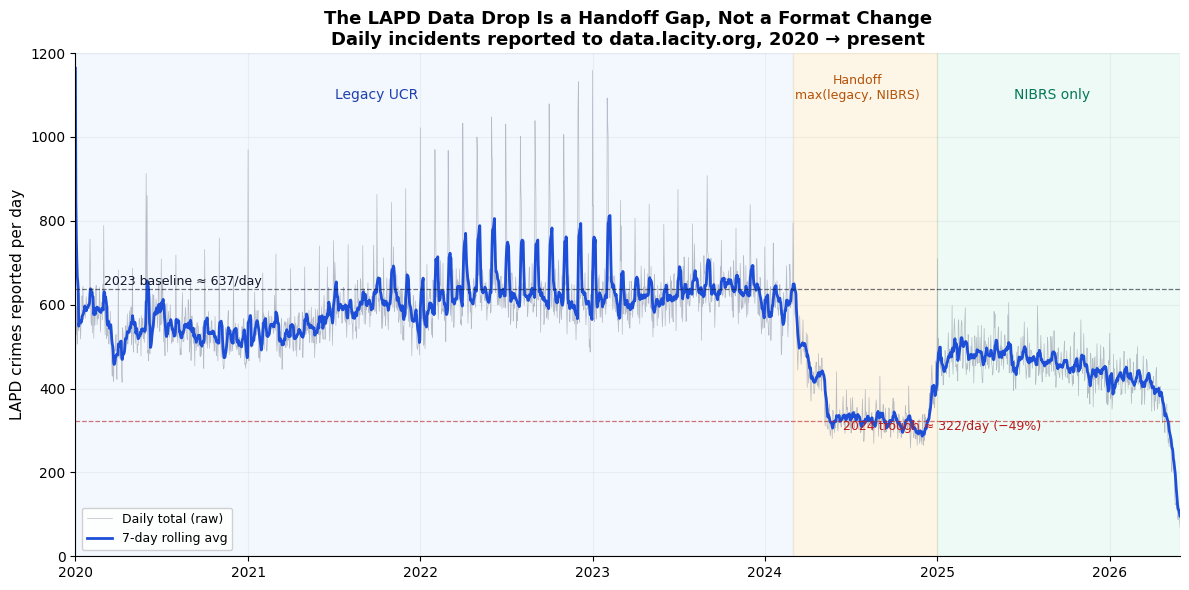
Three regimes are visible. From 2020 through February 2024, the legacy UCR feed runs steady: the rolling average sits in a band between roughly 520 and 680 incidents per day, averaging 636.6 per day across all of 2023. Beginning in March 2024, the total falls off a shelf. By the summer and fall of 2024 the rolling average bottoms out around 322 incidents per day — a decline of roughly 49% from the 2023 baseline. Then, under NIBRS-only reporting in 2025, it partially recovers and stabilizes near 469 per day — still about 26% below where legacy UCR had been.
This was flagged in real time, not in hindsight
The discontinuity is not an artifact of retrospective analysis. It was visible to anyone watching the feed, and it was documented as it happened. On February 5, 2025, SpotCrime wrote to Mayor Karen Bass and the Los Angeles City Council to report that the department's open crime data feed — the “Crime Data from 2020 to Present” dataset on data.lacity.org, the same series plotted above — had not updated past December 30, 2024. The letter noted that the feed “previously provided updates on a weekly basis, then biweekly, and now … has seemingly stopped updating altogether.”
That sequence matters. The cadence degraded before it broke, and the legacy feed went silent at the end of 2024 — exactly where the count series shows legacy reporting falling to zero and NIBRS taking over. The freeze coincided with the January 2025 Los Angeles wildfires, a genuine emergency a department could reasonably cite. But a feed that had already slipped from weekly to biweekly to nothing over the preceding months describes a maintenance problem that predates any single crisis — and it brackets the volume drop with a contemporaneous paper trail rather than a reconstruction after the fact.
Why the NIBRS explanation doesn't fit
The intuitive story is that this is what a NIBRS transition looks like — a format change that mechanically shifts the count. It does not hold up, for two reasons visible in the same data.
First: NIBRS was not quietly running in parallel and then switched on. Across all of 2020 through 2023, the NIBRS field in this feed carried an average of 0.77 offenses per day — effectively empty. NIBRS did not begin carrying real volume until March 2024, the exact month the total cratered. This was not a swap between two complete systems. It was one system being switched off before the other was switched on.
Second: the shape of the drop is a handoff artifact, not a recount. Watch the two feeds separately through 2024. The legacy UCR count, which had held near 600 per day in February, falls to about 303 in May, 271 in June, and 152 by December before going to zero in 2025. Over the same months, NIBRS ramps up from 71 per day in March to 153 in April to 330 by June. Because the deduplicated total takes the higher of the two feeds on each day, and because both feeds were partial during the handoff, the total reflects the maximum of two incomplete numbers. That is why it collapsed by half and then recovered as NIBRS filled in — a signature of an operational gap, not of a taxonomy that counts differently.
This matters because a NIBRS transition, done correctly, should produce more publishable detail per incident, not fewer incidents. NIBRS records multiple offenses per incident and drops the old hierarchy rule that suppressed lesser offenses — we walked through the mechanics in the incident-taxonomy and normalization problem. A format that captures more per incident cannot, by itself, explain a feed that publishes far fewer incidents. The count drop lives in the plumbing, not the format.
The part that stays unexplained
The deep trough of 2024 has a clean mechanical explanation: two partial feeds during a botched handoff. The harder question is why, after NIBRS-only reporting stabilized in 2025, the count settled at about 469 per day — a durable 26% below the legacy baseline — and has drifted slightly lower since. Three candidate explanations, none fully satisfying on its own:
- Real crime decline. Los Angeles crime did fall in 2024 and 2025, consistent with the national trend. But the national and citywide declines run in the single digits year over year — the US violent crime rate fell about 5.4% in 2024. A real decline can account for part of a 26% gap. It cannot account for most of it.
- NIBRS counting and deduplication differences. How a jurisdiction groups offenses into incidents, and how a publisher deduplicates records, can shift a daily count without any change on the ground. Some of the residual gap may be an apples-to-oranges comparison between a legacy incident count and a NIBRS incident-or-offense count. This is a measurement caveat, not an explanation — and it cuts both ways.
- Residual undercount. The possibility that the NIBRS-only feed is still not capturing every record the legacy feed did — that some categories or reporting divisions are incompletely represented. This is exactly the kind of gap that is invisible without a baseline to compare against, which is why the pre-2024 legacy series is worth preserving.
The honest position is that this series alone cannot fully partition the 26% among these three. What it can establish is that the residual gap is real, is large relative to any plausible true crime decline, and has not been publicly explained. That is a finding, and it is also an invitation for the department to close the question with a reconciliation the public can check.
Two defects, one fixed
It is worth separating the two LAPD data problems cleanly, because the recent good news addresses only one of them.
| Defect | What was wrong | Status |
|---|---|---|
| Location precision | Incidents present but geocoded only to a coarse area, not the block | Restored June 2026 |
| Incident volume | Roughly a quarter of the daily record count missing versus the legacy baseline | Open and unexplained |
The location fix is real and it followed a genuine public campaign. On June 2, 2026, SpotCrime asked its Los Angeles subscribers to contact city officials — Chief Jim McDonnell, the Board of Police Commissioners, the City Council, and the Inspector General — in a message titled “Take Action: LAPD Removed Crime Location Data. Here's Why It Matters.” Many wrote and called; the block-level locations returned shortly after the June primary, without a public announcement, following months of statements that restoration was not technically possible. One subscriber, writing back to thank the team, framed the open questions precisely: why block-level reporting could suddenly be restored after being called impossible, whether it is permanent, how often data would be updated, and what changed to make it possible. The department has since answered the cadence question in its own dataset metadata.
The notice attached to the LAPD dataset on data.lacity.org now states it plainly: “LAPD now publishes datasets sourced directly from the new Records Management System in accordance with NIBRS standards. These datasets were introduced in October 2024 and are refreshed on a bi-weekly schedule.” The legacy series plotted above — once titled “Crime Data from 2020 to Present” — has been renamed “Crime Data from 2020 to 2024” and marked as one that “will no longer be updated … historical reference only.” Per the dataset's Socrata metadata, that notice was added in the March 4, 2026 update.
So the schedule question is settled, on the record and in LAPD's own words: biweekly, NIBRS-sourced, with the old series formally retired. What that official notice does not address is the one this post is about. A feed can be consistent in its schedule while remaining inconsistent in its completeness — and a bi-weekly refresh of a series running a quarter below its own historical baseline still leaves the volume gap unexplained.
What consumers of this feed should do
For anyone building on LAPD data — real estate platforms, insurers, researchers, safety apps — the practical implications are concrete:
- Do not compare across the March 2024 seam without a correction. A year-over-year query that straddles the handoff will read a reporting discontinuity as a crime decline. The transition window (roughly March through December 2024) should be treated as a break in the series, not a trend.
- Discount the last several weeks of any pull. The steep fall at the right edge of the chart is ingestion lag. Recent incidents populate over days and weeks; treating the most recent window as complete will understate current activity.
- Normalize, don't just ingest. This is the reason a raw municipal feed is not a product. Detecting a structural break, holding the pre- and post-transition series comparable, and flagging lag are normalization work — the layer between an open-data portal and a number you can act on. We made the general version of that argument in How to Evaluate a Crime Data API.
The encouraging part of the LAPD story is that public pressure worked on the question it was aimed at. The unfinished part is that the louder, harder-to-see problem — a feed that has quietly published a quarter fewer records per day since March 2024, for reasons a NIBRS transition cannot explain — is still waiting for an answer. A city that can restore block-level locations the week after an election can reconcile its own incident counts. Until it does, the series carries a discontinuity that every serious user of the data has to correct for by hand.
Access Address-Level Crime Data
Real-time incidents · free A–F Crime Grade · rolling 90-day window · 22,000+ US cities. Normalized and verified — because raw data isn't enough.